SAP Analytics Cloud (SAC)
In this specialist article, you will get a comprehensive insight into the SAP Analytics Cloud (SAC) functionalities that you can use to implement your reporting in an advanced cloud application.

Consultant Business Intelligence at FIS
What is SAP Analytics Cloud and what functions does it include?
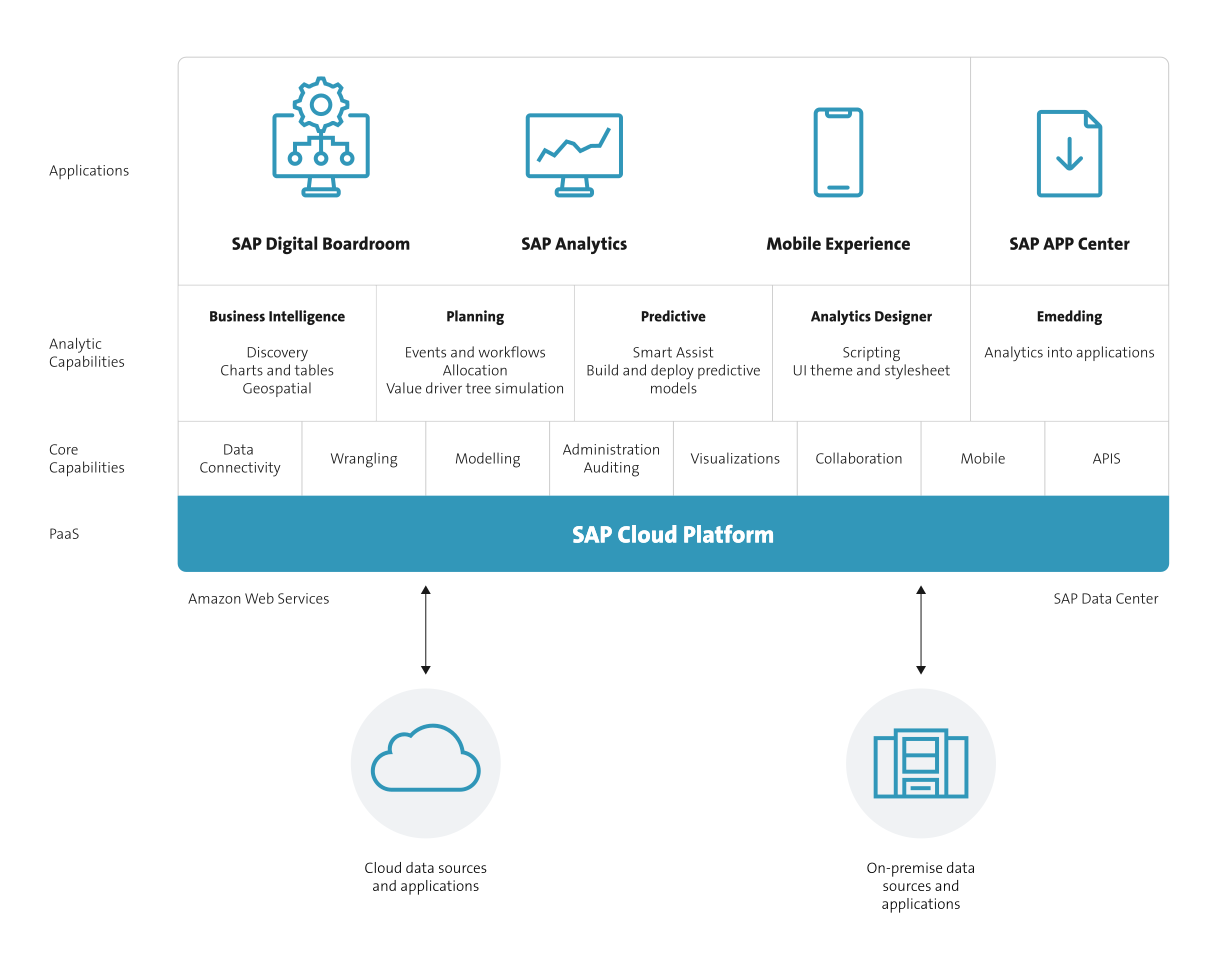
SAP Analytics Cloud (SAC) is the analytic front-end solution set for the long term in the SAP strategy, which is available as a Software-as-a-service offer (SaaS) and executed in the local browser of HTML5 (Google Chrome or Microsoft Edge). The data visualization can also be used in mobile form in a native app on iOS and Android devices.
With the “Self-Service BI” application, Analytics Cloud provides options for Business Intelligence analyses, makes collaborative enterprise planning available, can integrate machine learning and predictive analytics abilities and, as a consequence, contributes to a faster analysis, more reliable insights and profitable decision making.


Core components incl. features
Business Intelligence & reporting
Planning & forecasts
Collaboration
Smart features with artificial intelligence (machine learning)
Business Intelligence & Reporting
The primary focus of the application is on an easy and intuitive creation of analysis stories (reports) without the know-how of an IT department and on the optimal support of specialists and executives in decision making by using the data visualized in this way. SAP Analytics Cloud is able to provide holistic insights by using data from different data sources, no matter if replicated data or live data in real time is concerned. Sources might be diffferent SAP or non-SAP systems, cloud data sources or even simple CSV files.
As a consequence, the data to be evaluated is either technically loaded into “import data models” in SAP Analytics Cloud or fetched from an on-premise SAP S 4HANA or SAP BW or SAP BW 4HANA system via a “live data connection” to ensure that the entire data flow securely takes place in a separate enterprise network here. The reporting application is locally executed and visualized in the browser by using SAC metadata in HTML5 and JavaScript.
Data visualization
SAP Analytics Cloud offers a comprehensive visualization tool consisting of charts, graphics and geographical maps as well as implementation according to IBCS Notation. If this tool is not sufficient, even interactive cockpits and dashboards can be programmed by using the Application Designer in order to provide users with more flexibility in the analyses.
Video data story
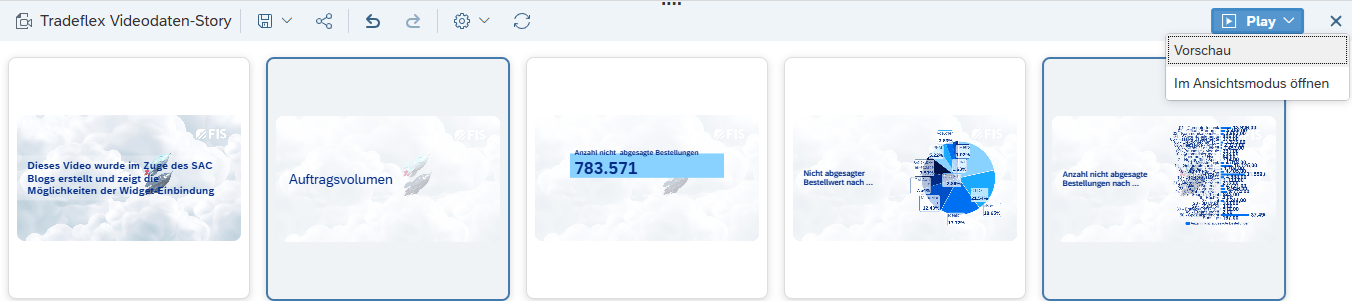
Another visualization feature is the “video data story”. It can be used to create easily understandable videos with a few clicks, which might include essential story contents (texts and graphics). This means that users can create catchy presentations in the video format, use them for meetings or make them available for different target groups – even without SAC access.
In addition, the data can also be consumed via SAC add-ins in Microsoft Excel and even planning data can be entered here. In the “optimized view mode”, SAC stories can also be called in mobile apps on iPhones, iPads, Android phones or tablets.
Planning & forecasting
In the area of planning & forecasting, IT users can implement different scenarios of a standalone or integrated enterprise planning across several business processes or use them by accessing the provided business content.
In the reporting or planning environment, the contents available in the “content network” might consist of SAP developments as well as of third-party solutions (i.e. developed by SAP partners). In most cases, data models as well as planning stories from the “finance”, “controlling” or “sales and distribution” areas can be found there and used as a basis so that a complete initial creation is not necessary.
The core elements in the “planning” area are versatile as it is possible here to define separate coding in planning functions. In this way, customer-specific calculations of key figures can be created.
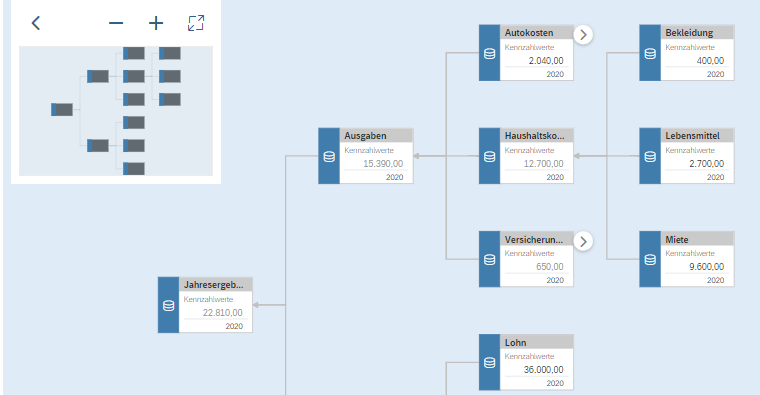
However, the use of allocation functions or value driver trees available in the SAC standard version is possible as well. The value driver trees will then allow a kind of visual planning, where the dependencies on key figures and their effects in case of data changes are visible in a graphic widget.
SAP Analytics Cloud Compass
Since the Q1.2025 Release, the “planning” theme, and “simulation” in particular, is complemented by a new feature: the SAC “Compass”. It enables a Monte Carlo simulation of interval areas in planning data by using a model or a story table as a basis. Here, the most probable results are visualized, which are calculated by using changes in different value drivers.
Furthermore, there are two other functionalities worth mentioning in the area of “user experience” that were missing in previous SAP planning solutions.

Version management
Each planner can create their own private version copy by using the current planning status, change data and check effects in this copy without all other planners being able to see it or being influenced by it. Only at the end, when the new planning values have satisfyingly been entered, the private version can be copied to the public version again, which is accessible for all planners.
Simplified relative data entry
Planners frequently wish to increase specific values on a percentage basis, which is very easily enabled by entering + x % in the SAC planning layout. In the background, the old values are recalculated on the lowest level by using this entry and then shown to the user again. The same procedure works with the entry of an absolute value, e.g. +5,000.
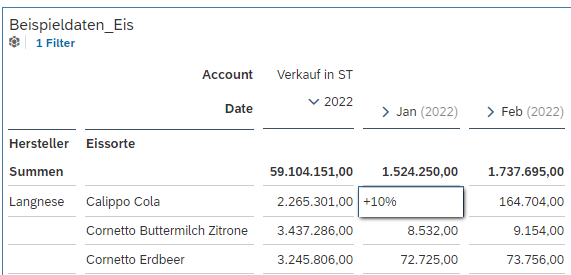
Even if a hierarchy is based on several levels, whose leaves contain different values, the newly entered value will be distributed on all levels in proportion to the old value. The complex “Move values” function, which provides users with even more individual planning options, works in a similar way.
Collaboration
In “Analytics Cloud”, SAP closes another gap caused by former restrictions in previous reporting applications by making comprehensive coworking components available for collaboration.
Chat

An example in this context is that the integrated chat function can be used by clicking on the speech bubble icon in the right upper corner of the application in order to discuss specific reports, analyses or analysis results with colleagues.
Commenting
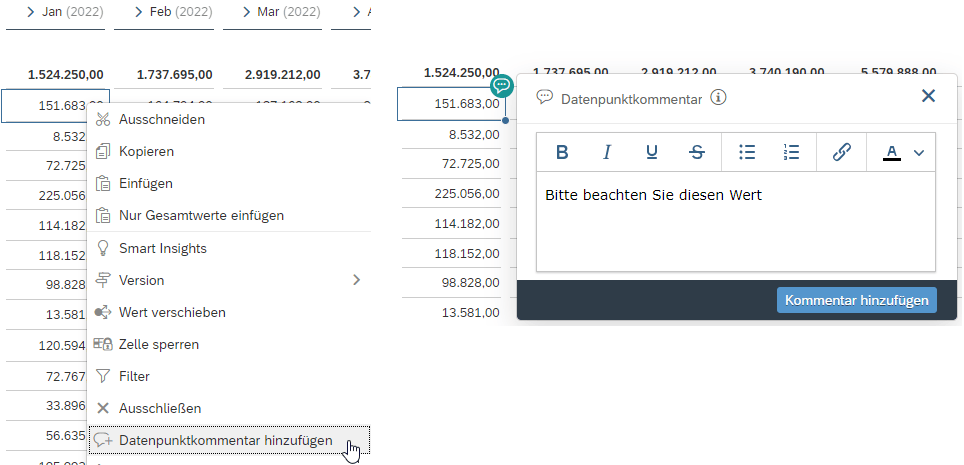
By means of the speech bubble icon in the context menu of a graphic or a table, the respective selection can be directly commented. This comment can only be read or answered by persons authorized for the same data.
Bookmarks
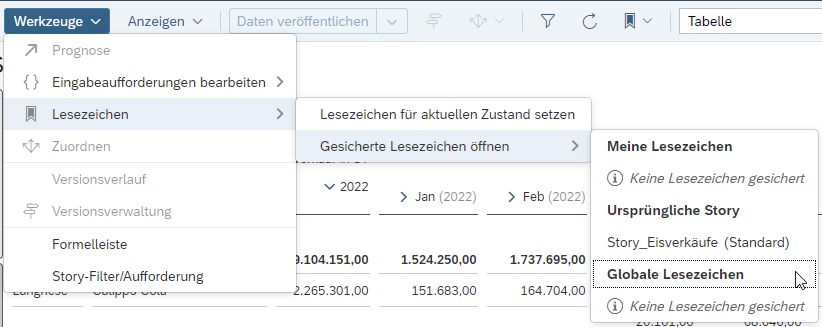
Even bookmarks, as known from previous Web reporting tools, can be created – either as personal bookmarks that nobody else can access or as global bookmarks which can also be shared within a team. The bookmarks can then be directly called in the SAC story without having to be saved in the user’s favorites.
Integrated calendar
The most important collaboration case, however, occurs during the planning phase, i.e. when numerous persons involved have to create a common planning. Here, creator, approver or viewer roles can be defined and the entire process can be controlled via the calendar integrated in SAC. In this way, progress can be documented or users can be requested to enter or approve data, without an external tool having to be applied for this purpose.
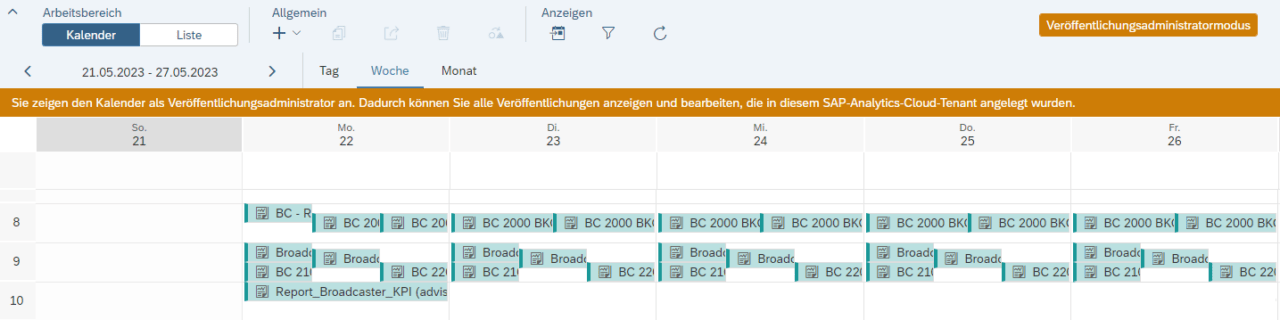
The planning process defined in this way can be repeated in the following year and in the same quality on the basis of the tasks and steps carried out.
PDF & e-mail transmission
In addition, it has to be mentioned that SAC stories, needless to say, can also be saved as PDF files, even be updated regularly in an automated way and sent to authorized users via e-mail.
Smart features
Further highlights included in SAC and intended to support enterprises in their analyses and decisions are the smart analysis functions providing results based on the existing data by using AI.
Four different solutions can be used here:
Smart Discovery
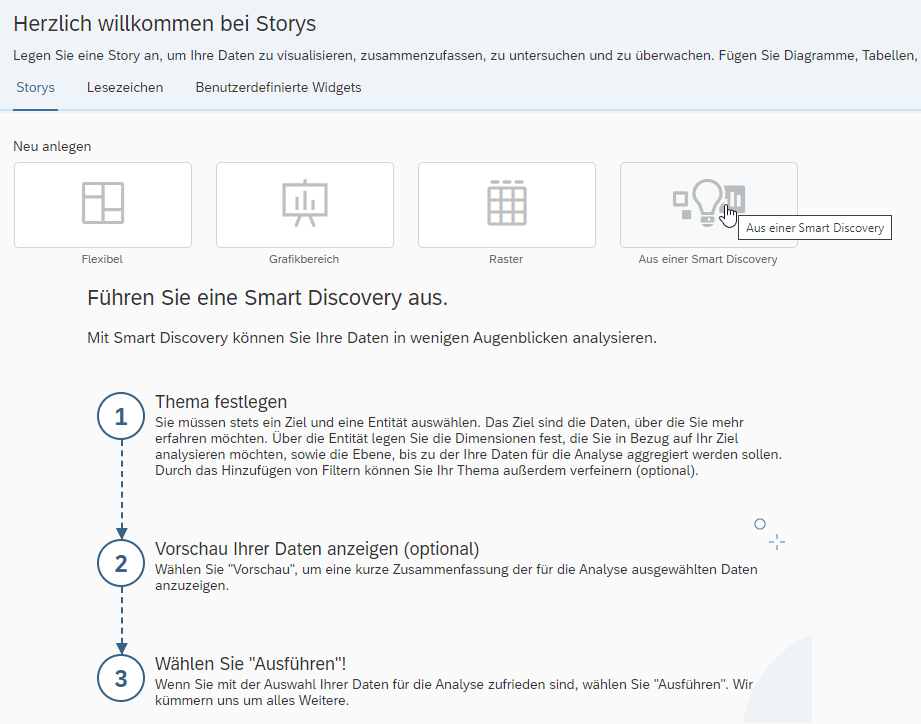
Smart Discovery can be used to generate several reports that SAC determines and visualizes by using predefined standard search variants (e.g. the largest contributing factors). In this way, insights into new data or new analyses based on well-known data are enabled.
Smart Insights
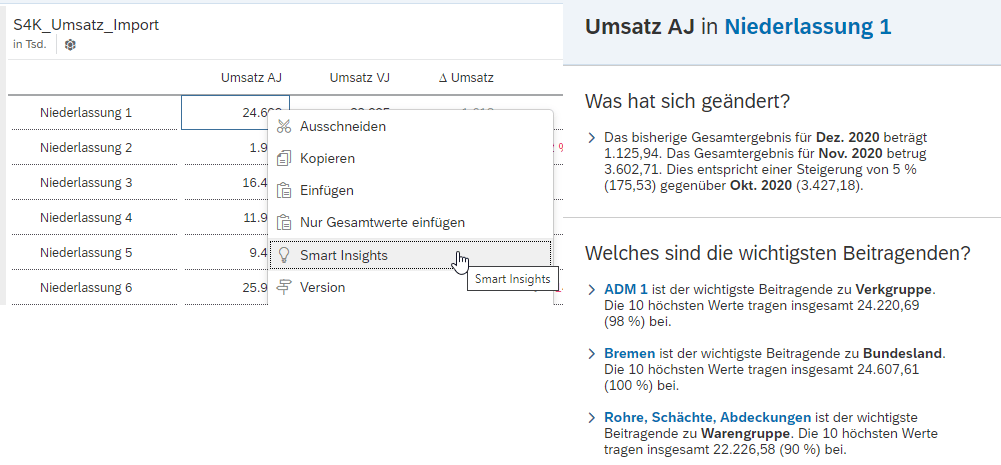
Smart Insights is an analysis function within an SAC story or even based on table or graphics data. Via right-hand click, additional information can be shown here, which provides further insight into the key figure and its composition (of the underlying characteristics in the data records).
Smart Predict
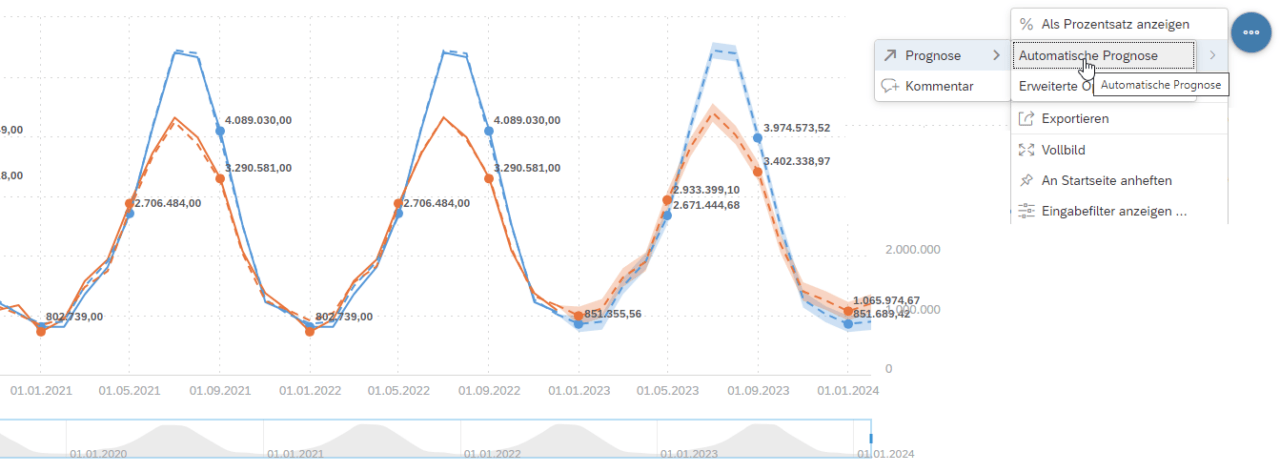
Another helpful functionality that has only been contained in a data warehouse so far, is “Smart Predict”. This integrated “predictive analytics” solution can be used to make different predictions based on the existing data:
Search-to-Insight
Currently, the “Search to Insight” function, which can be used to control analyses via entries in text form, is still in the first expansion phase. Arithmetic identifies characteristics and key figures of models and can automatically and suitably visualize the data generated therefrom. However, the entry only works in English language (version Q2.2023)
Conclusion
In the past (until the end of 2022), the primary SAC source systems were SAP S4 HANA systems or classic SAP BW or BW4 systems as they were most suitable for live reporting without requiring major adaptations or additional data loading.
Since 2023, SAP has been increasing its investments in its new Cloud Data Warehouse product, i.e. SAP Datasphere (former Data Warehouse Cloud), in order to continuously expand its “cloud first” way even in the warehousing environment.
By implementing the “analytic model”, which is to be understood in a similiar way as a BW query, this SAP Business Technology Platform (SAP BTP / former SAP Cloud Platform) product has now also taken the decisive step in SAC live reporting to enable SAP customers to take it into account as an equal system for integration into the analytics landscape.